ORACLE: Most V1 chatter stays local, while a privileged bit gets passed on
July 23, 2019
The writing of this post was led by Chaoqun Yin, a graduate student in the Churchland lab. This paper is actually not on the biorxiv- note to authors: pls put preprints there.
Today’s paper is Cortical Areas Interact through a Communication Subspace, by João D. Semedo, Amin Zandvakili, Christian K. Machens, Byron M. Yu, and Adam Kohn. In this paper, the authors argue that different subspaces are used in V1 intra-areal communication vs. V1-V2 communication. This mechanism may help to route selective activity to different areas, and reduce the unwanted co-fluctuations.
Approach:
Data Collection: The neuronal data Semedo et al. used was recorded in three anesthetized macaque monkeys. They measured neuronal activity as spike counts in 100 ms bins during the presentation of drifting sinusoidal gratings. All analyzed neurons had overlapping receptive fields, and were located in the output layers of V1 and the middle layers of V2 (the primary downstream target of V1).
Neuron Grouping: To distinguish the V1 intra-areal interaction and V1-V2 interaction, the authors divided V1 neurons into source and target populations by matching the target V1 population to the neuron count and firing rate distribution of V2 population.
Subspace Analysis: To test whether the activities of target V1 and V2 only depend on a subspace (“predictive dimensions”) of source V1 population activity, Semedo et al. used reduced-rank regression (RRR)— which constrains the regression result into a low-dimensional space— on the source V1 population. After getting the predictive dimensions, natural next question is this: do the target V1 predictive dimensions align to the V2 predictive dimensions? That is, do the V1-V1 and V1-V2 interaction share the same subspace? To address this, Semedo et al. removed neuronal activity along target V1 or V2 predictive dimensions and tested how the predictive performance changed across areas.
Main take-home:
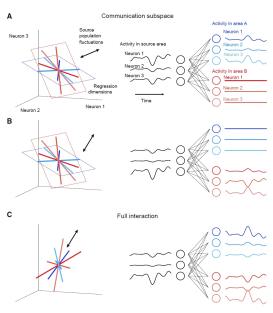
Surprisingly, V2 activity is only related to a small subset of population activity patterns in V1 (the “source” populations). Further, these patterns are distinct from the most dominant V1 dimensions.
The predictive dimensions of V1-V1 and V1-V2 communications are largely non-overlapping. This implies that the V1-V1 and V1-V2 interactions may leverage different subspaces. (See the right figure). Why might such a configuration occur? The authors proposed that this configuration would allow V1 to route selective activity to different downstream areas, and reduce unwanted co-fluctuations in downstream areas (related to an idea in Kaufman, Shenoy et al 2014)
Skeptics Corner: A small one: In the paper, fig 2B (the figure at left) shows the source V1 population activity can predict V2 activity as well as V1 activity can predict its own activity. This was puzzling: we would have thought that it is easier to predict neural activity in the same area because the neurons in the same area may be more interconnected compared to neurons in different areas. We aren’t quite sure about the anatomy here. Perhaps the V1-V1 and V1-V2 connections are similar in amount and strength if all these neurons share overlapped receptive field?
Outlook:
This paper raises an intriguing mechanism for inter-areal interaction: one brain area can project selective information to specific downstream areas through different communication subspaces. Semedo et al. tested this idea on a dataset recorded in anesthetized monkeys. We wonder if this mechanism can be found in awake, and even free-moving animals. Moreover, the authors mainly used a passive grating watching task. But if this is a general mechanism for inter-areal interaction, it would be interesting to look for similar phenomena in more complicated visual tasks and especially multisensory tasks.
Finally, the authors plotted the neuronal activity in a neural space where each axis represents the activity of one neuron. In this case, the weights of all neurons can be represented as a regression dimension across the neural space. If we can keep recording the same neuron group for a long period, we would get the long-term changes of these weights. Then maybe we can use the weights as axes to get a weight space, which shows the change of each neuron’s contribution to the population activity.
References:
- Semedo, J. D., Zandvakili, A., Machens, C. K., Byron, M. Y., & Kohn, A. (2019). Cortical areas interact through a communication subspace. Neuron, 102(1), 249-259.
- Kaufman, M. T., Churchland, M. M., Ryu, S. I., & Shenoy, K. V. (2014). Cortical activity in the null space: permitting preparation without movement. Nature neuroscience, 17(3), 440.
